Professional developers don’t randomly try fixes. They follow a structured debugging methodology, use the right tools, and understand how JavaScript behaves under the hood.
This guide walks you through exactly how to debug JavaScript code like a pro—fast, systematic, and efficient.
The Mindset Shift: Stop Guessing, Start Tracing
Most beginners debug like this:
Change something
Refresh
Hope it works
Professionals debug like this:
Observe
Hypothesize
Test
Confirm
Debugging is not trial-and-error—it’s controlled investigation.
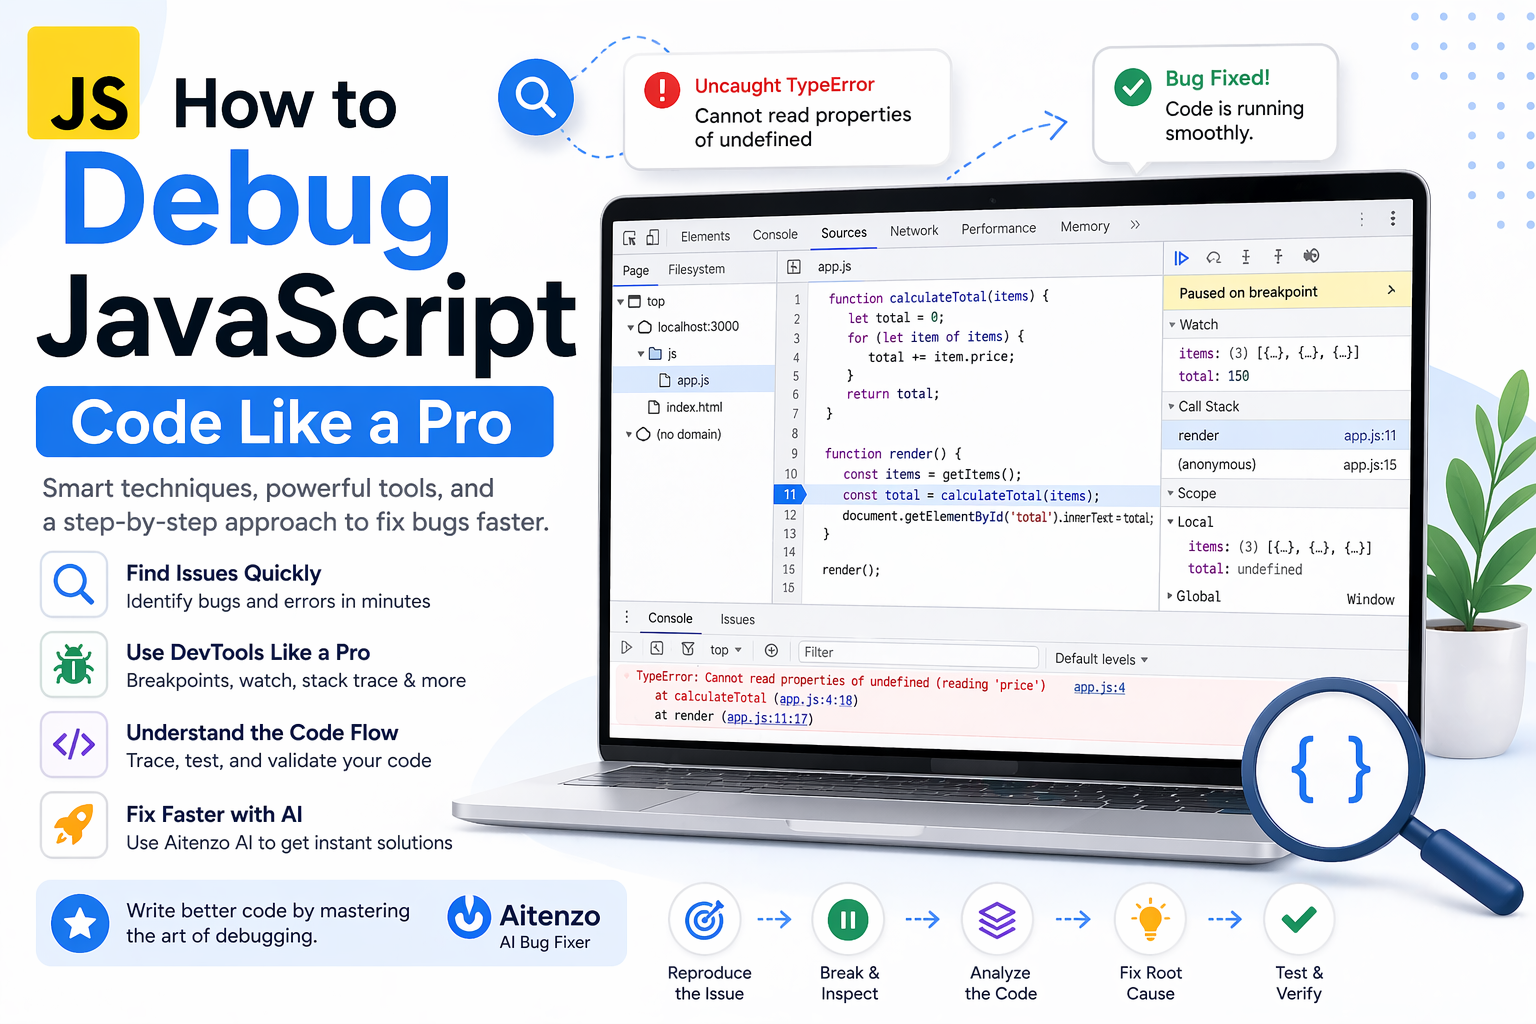
Step 1: Read the Error Message (Properly)
When JavaScript throws an error, it gives you:
Error type
File name
Line number
Example:
TypeError: Cannot read properties of undefined (reading 'name')
This tells you:
You’re accessing
.nameOn something that is
undefined
Most developers ignore this and jump to guessing—that’s the mistake.
Step 2: Reproduce the Problem Consistently
If a bug happens “sometimes,” you don’t have control yet.
Make it:
Repeatable
Isolated
Strip your code down to the smallest version that still produces the bug.
Step 3: Use Console Like a Surgeon (Not a Hammer)
The console is your first debugging tool—but it must be used strategically.
Inspect values
console.log(user);
Check types
console.log(typeof user);
Trace flow
console.log("Step 1");
console.log("Step 2");
Advanced logging
console.table(users);
console.dir(object);
Don’t spam logs—log with intent.
Step 4: Use Browser DevTools (Your Real Power Tool)
Every professional relies on DevTools (Chrome, Edge, etc.).
Key features you should master:
1. Breakpoints
Pause execution at a specific line.
Inspect variables in real-time
Step through code line-by-line
2. Watch Expressions
Track values dynamically as code runs.
3. Call Stack
Understand how your function was invoked.
4. Network Tab
Debug API calls:
Request payload
Response data
Status codes
If you’re not using breakpoints, you’re debugging blind.
Step 5: Understand Common JavaScript Pitfalls
Most bugs fall into predictable categories.
Undefined / Null Errors
user.name // user is undefined
Fix:
user?.name
Scope Issues
if (true) {
  let x = 10;
}
console.log(x); // ❌
Async Bugs
let data = fetch("/api"); // missing await
Fix:
let data = await fetch("/api");
this Context Problems
const fn = obj.method;
fn(); // ❌
Fix:
fn.call(obj);
Recognizing these patterns instantly cuts debugging time in half.
Step 6: Binary Search Your Code
If you don’t know where the bug is:
Comment out half the code
Test
Narrow down
This is called divide and conquer debugging.
It’s fast and extremely effective for large codebases.
Step 7: Validate Assumptions (Most Bugs Live Here)
Ask yourself:
Is this variable what I think it is?
Is this function returning what I expect?
Is this API actually responding correctly?
Never assume—verify everything.
Step 8: Use AI to Debug Faster
Modern debugging isn’t just manual anymore.
Tools like:
Aitenzo
ChatGPT
can:
Analyze your code
Identify root causes
Suggest exact fixes
Instead of spending 30 minutes tracing, you can:
Paste error
Get solution in seconds
Professionals use AI as a debugging accelerator, not a replacement.
Step 9: Read the Stack Trace
Example:
at getUser (app.js:10)
at main (app.js:20)
This shows:
Where the error happened
How execution reached there
Understanding the stack trace helps you trace bugs back to their origin.
Step 10: Fix the Root Cause, Not the Symptom
Bad fix:
if (user) console.log(user.name);
Good fix:
Why is
userundefined?Fix that source
Temporary fixes create future bugs.
Pro-Level Debugging Workflow
Here’s how experienced developers debug efficiently:
Read error message
Reproduce issue
Inspect values (console / DevTools)
Identify pattern (type, async, scope)
Narrow down with breakpoints
Fix root cause
Optimize with AI tools
Advanced Tips Most Developers Miss
Use Source Maps
Debug minified production code easily.
Enable Strict Mode
"use strict";
Catches silent errors.
Log Errors Properly
console.error(err);
Keep Functions Small
Smaller functions = easier debugging.
Developer Insight
Debugging is not about tools—it’s about clarity.
Once you:
Understand JavaScript behavior
Recognize error patterns
Follow a structured approach
You stop feeling stuck.
And when you combine that with tools like Aitenzo, debugging becomes not just faster—but predictable and controlled.